
Campaign Analytics
There are two analytics views, and it’s worth knowing which is which. The Analytics tab (top level) shows performance across all your campaigns over a chosen window. Each campaign also has its own Analytics tab — a lifetime deep-dive into that one campaign.
Cross-campaign Analytics
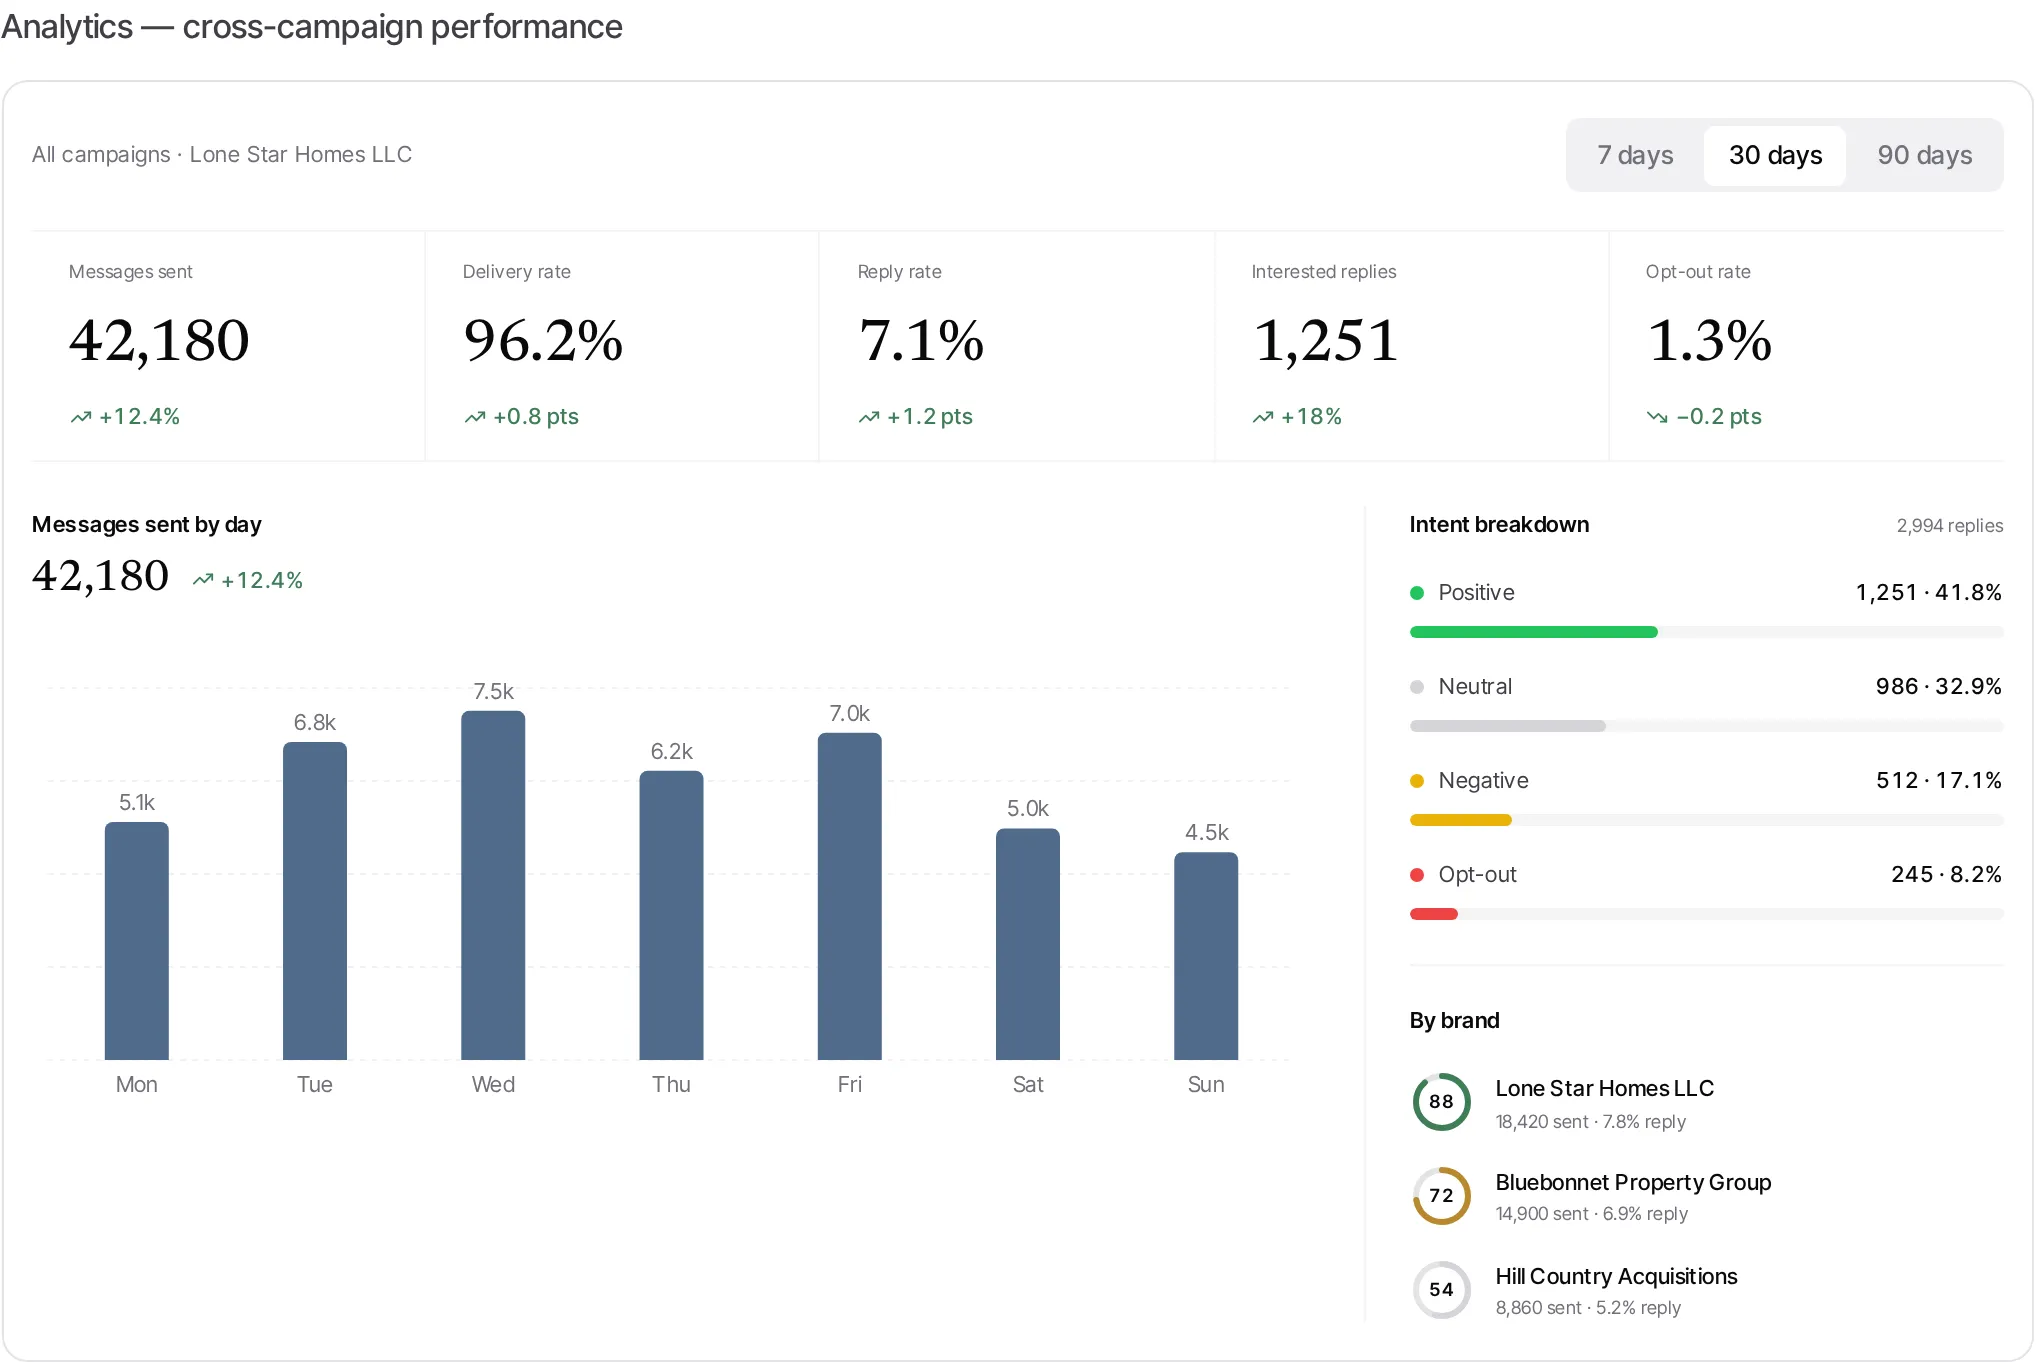
Section titled “Cross-campaign Analytics”The top-level Analytics tab opens with a scope line (for example, All campaigns · Lone Star Homes LLC) and a period toggle — 7 days · 30 days · 90 days. Below it, five headline numbers, each with a trend delta versus the prior window, then a daily volume chart, an intent breakdown, and a per-brand scorecard.
What each KPI means
Section titled “What each KPI means”- Messages sent — total texts that went out in the window. Your raw activity, and the denominator for everything else.
- Delivery rate — delivered ÷ sent. Your deliverability health. A dip here often means a registration or number-reputation issue worth investigating before you scale up.
- Reply rate — replies ÷ sent. The clearest read on whether your list and opening message are resonating.
- Interested replies — the count of replies scored as positive — the ones actually worth a call. This, not raw reply rate, is the number tied to revenue.
- Opt-out rate — opt-outs ÷ sent. The one metric where down is good — a falling opt-out rate is shown in green. Climbing opt-outs mean your list or message is rubbing people the wrong way.
Below the KPIs:
- Messages sent by day shows volume and momentum for the period.
- Intent breakdown scores every reply as Positive, Neutral, Negative, or Opt-out.
- By brand gives each sending identity a 0–100 score with its sent and reply figures, so you can see which identity is carrying its weight.
Per-campaign Analytics — the delivery funnel
Section titled “Per-campaign Analytics — the delivery funnel”Inside a single campaign, the Analytics tab reframes the same data as a funnel: “From carrier queue to a scored, interested reply.” It walks each stage — Sent → Delivered → Replied → Interested — with the conversion rate between them, alongside a reply-intent breakdown, the sending brand’s deliverability, a sequence summary, and recent responses (with a jump to the inbox).