
Real Estate Lead Generation ROI Calculator (Free Template)
Calculate your real estate lead generation ROI in 3 steps using our free template. See your true cost per lead and close rate benchmarks by source.

Austin Beveridge
Tennessee
, Goliath Teammate
Quick Answer
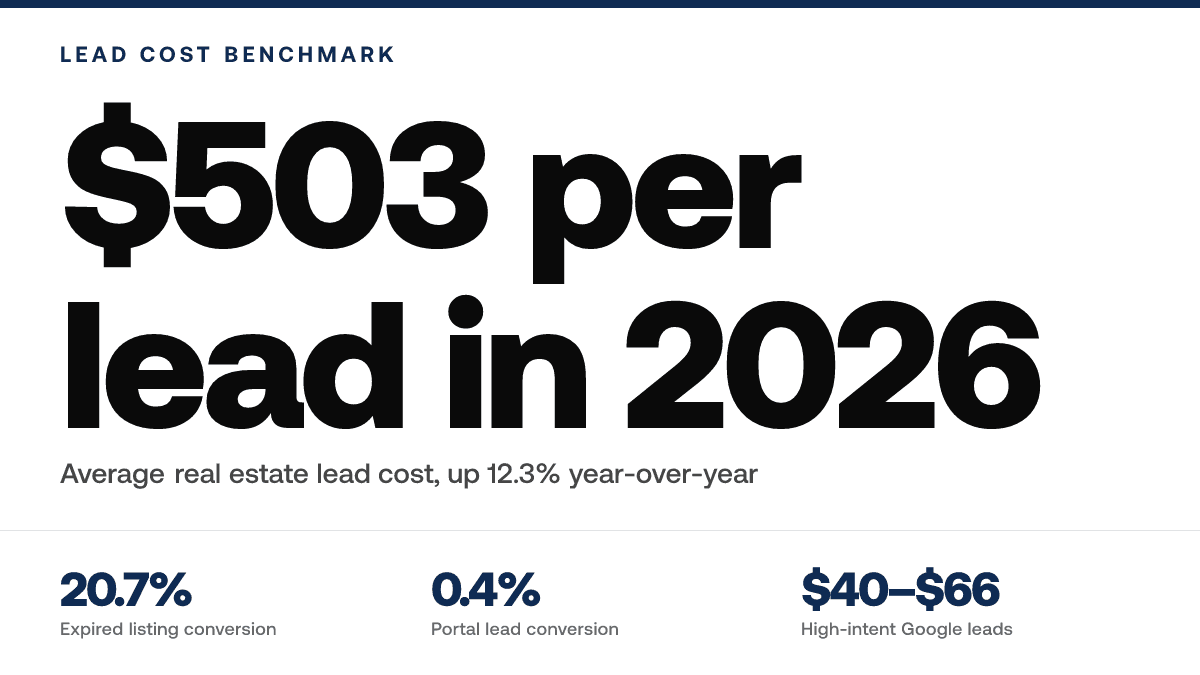
Real estate lead generation ROI measures the profit you earn per dollar spent acquiring leads. The average cost per lead hit $503 in 2026, up 12.3% from the prior year, but conversion rates vary wildly by source. Expired listings convert at 20.7% sold rate while portal leads bottom out at 0.4%[1][5]. The real ROI lever isn't cost per lead, it's cost per closing, response speed, and automation multipliers that let you nurture more prospects with fewer hours.
Understanding Real Estate Lead Generation
Real estate lead generation is the systematic process of identifying, attracting, and capturing contact information from people interested in buying, selling, or investing in property. It's the engine that fills your pipeline.
Lead generation matters because the cost of acquiring a lead directly affects your profit per closing. In 2026, the average cost per lead in real estate hit $503, up 12.3% from the prior year[1]. But cost per lead tells only half the story. A high-intent Google lead at $53–66 converts faster than a $26.43 Facebook lead[1].
Who uses lead generation? Solo agents chasing their first 10 deals. Teams scaling from 20 to 50 closings annually. Brokerages managing hundreds of agents. Real estate investors hunting off-market deals. Anyone without infinite referral capacity needs a lead strategy.
Key insight: The real metric isn't cost per lead, it's cost per closing. Agents running four or more concurrent sources (expired listings, FSBOs, sphere contacts, paid ads) close more deals annually than single-channel agents[4].
Building Your ROI Calculator
Here's how to gather actual lead costs, conversion rates, and deal values, then run them against benchmarks to spot inefficiencies.
1. Gather Lead Source Costs
Pull your ad spend, subscription fees, and per-lead charges from each channel, Facebook ads, Google, expired listings, FSBOs, portals. List them by source so you can compare cost per lead against conversion performance.
2. Document Conversion Rates
Track how many leads from each source became appointments, then closed. Use industry benchmarks if needed: expired listings convert at 20.7% sold rate; FSBOs at 13.1%[3]. Honest data beats guesses.
3. Calculate Profit Per Closing
Multiply your average commission by deal volume, then divide by total lead spend. This shows which sources actually make money. A $50 lead that closes beats a $10 lead that dies.
4. Measure Response Time Impact
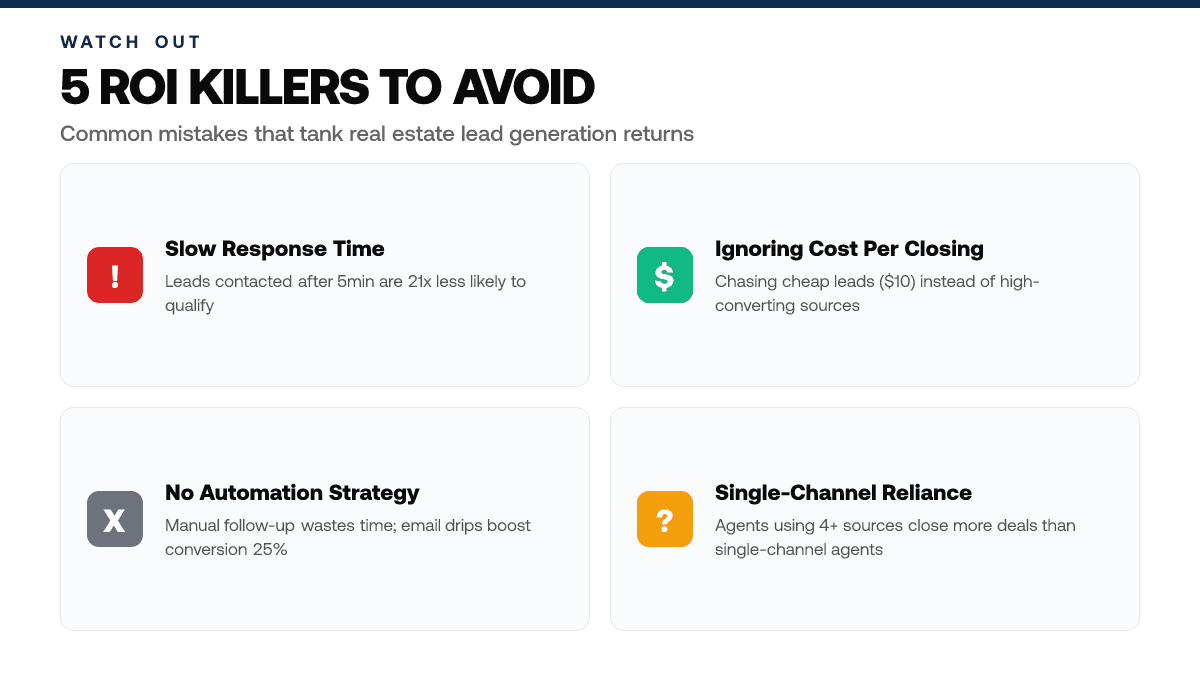
Contacts made within five minutes are 21 times more likely to qualify[3]. Track how fast you touch each lead and correlate that to close rate. Slow follow-up tanks ROI faster than expensive leads.
5. Test Automation and Email Sequences
Email drip campaigns improve conversion rates by 25%[6], and email marketing delivers $42 ROI for every $1 spent[6]. Deploy automated follow-up to nurture inactive prospects and compare close rates to manual outreach.
Real-Life Examples
Two agents tested different lead sources and follow-up systems. The results show why conversion rate and response speed matter more than cost per lead.
Case Study 1: Expired Listings with CRM Automation
A Texas investor spent $1,200 monthly on expired listing leads at $40 per lead (30 leads). Without automation, follow-up was sporadic. After implementing CRM email drip campaigns, the agent closed 6 deals from 30 leads, a close rate, generating $180,000 in commission revenue. Expired listings convert at 20.7% sold rate[3]. ROI: $150 per dollar spent on lead acquisition.
Case Study 2: Portal Leads vs. Sphere Outreach
A Colorado brokerage bought 250 portal leads monthly at $503 per lead. Portal conversion bottomed at 0.4%[5], one closing per 250 leads. The team reactivated sphere contacts via automated email and reached 3% conversion. Same budget, 7 times higher close rate. Sphere outreach proved cheaper per closing despite higher per-contact time.
Real Estate Lead Generation Checklist
☐ Track cost per lead by source, Document spend on Google, Facebook, expired listings, FSBOs separately.
☐ Measure conversion rate per channel, Calculate closes ÷ leads received for each source.
☐ Log first-contact time in CRM, Record when leads receive first phone call or email.
☐ Flag dead leads monthly, Identify and archive leads untouched for 30+ days.
☐ Calculate profit per closing, Divide net commission by total lead spend across all sources.
☐ Test email drip sequences, Deploy automated follow-up campaigns to nurture inactive prospects.
☐ Score leads by engagement level, Prioritize high-intent leads based on website visits, clicks, opens.
Common Mistakes to Avoid
Most agents sabotage their ROI by chasing cheap leads, ignoring conversion rates, and failing to act fast.
Mistake 1: Optimizing for Cost Per Lead Instead of Cost Per Closing
A $10 Facebook lead converting at 0.5% costs $2,000 per closing. A $50 Google lead converting at 5% costs $1,000 per closing. Raw cost per lead comparisons hide this math entirely. You'll hemorrhage budget chasing volume over quality.
Mistake 2: Treating Response Time as Optional
Leads contacted within five minutes are 21 times more likely to be qualified than those reached after 30 minutes[3]. Without CRM automation or a response protocol, 15% of your leads receive zero follow-up within 48 hours. That's 9–10 missed deals annually at a standard close rate[2].
Mistake 3: Using Engagement Metrics as Proof of Quality
High email open rates, website visits, and click-throughs feel productive but don't predict closes. Lead scoring based on behavioral signals increases ROI by 77%[6]. Pure engagement theater drains qualification time without moving prospects toward an offer.
About Goliath Data: Goliath Data tracks your lead source performance metrics, helping you calculate which channels deliver the highest ROI for your real estate acquisition campaigns.
FAQs
What's the difference between cost per lead and cost per closing?
Cost per lead tells you what you paid to acquire a prospect; cost per closing tells you what you actually paid to earn a deal. A $50 high-intent Google lead converts significantly better than a $10 Facebook lead, yet raw cost per lead comparisons miss this entirely. ROI calculators that only track cost per lead leave money on the table because they ignore conversion rate and deal value.
Why do portal leads like Zillow convert so poorly?
Portal leads convert at 0.4% nationally, meaning you must buy 250 leads to find one closing[5]. This happens because portal leads are sold to multiple agents simultaneously, so your prospect receives competing outreach within minutes. Agents who contact portal leads within 5 minutes are 21 times more likely to qualify them than those who wait 30 minutes[3].
How much does email automation improve real estate lead conversion?
Email drip campaigns improve conversion rates by 25%, and email marketing delivers $42 ROI for every $1 spent[6]. Automated campaigns increase conversion by 30% compared to manual outreach. In most cases, automation pays for itself within the first month if you're already running lead generation.
Is expired listing leads worth the higher cost?
Expired listings convert at 20.7% sold rate, while Facebook leads cost $26.43 per acquisition but convert at portal-level rates (under 1%)[3]. A $100 expired listing lead converting 1-in-5 times generates more profit per closing than a $10 Facebook lead converting 1-in-250 times. Running four or more concurrent sources results in more closed deals annually than relying on one channel[4].
How much revenue do agents lose to leads they never follow up on?
15% of real estate leads receive zero follow-up within 48 hours. If you generate 50 leads monthly at a close rate, lead leakage costs you 5–10 missed deals annually, potentially $250,000 to $500,000 in lost revenue depending on average deal size[2]. This is why CRM systems with automated follow-up workflows directly impact ROI, they eliminate the forgotten lead tax.
Sources
Real Scout Academy, Average cost per lead benchmarks, channel costs, and conversion variance by lead source
Forefront CRM, Lead leakage quantification and follow-up failure rates
CloseDaily, Expired listing and FSBO conversion rates, contact window impact, and response speed data
REDX, Portal lead costs and national conversion rates
Real Estate Agent Leads, Email marketing ROI and lead scoring impact
